Disclaimer: This article presents an independent opinion and analysis brought together by Burgex, Inc. based on public policy developments, market trends, and demographic forecasts.
The Clock on Demand Has Started
The clock on demand has started: record industrial draw for metals, a binding grid rule, a fixed highway window, and an EV market that’s maturing—not stalling—now define the next two years. Metals strength is here, transmission planning is locked in, highway dollars taper after 2026, and EVs are choosing winners by chemistry and cost.
Silver’s industrial use hit a record 680.5 million ounces in 2024, driven by solar, grid hardware, and electronics—including AI infrastructure—which means factories and power projects are already buying more metal now, not just planning for later. [7]
FERC’s transmission rule (Order 1920) is in force, requiring regional planners to publish long horizon portfolios with clear cost sharing—turning grid expansion into dated project lists and multi year orders for copper, aluminum, steel, and specialty components. Plainly: paperwork is becoming scheduled projects. [9]
Highway and bridge funding runs through FY2026 under the IIJA, creating a defined near term runway for public works that keeps aggregates and cement moving; what happens after 2026 depends on reauthorization. [2]
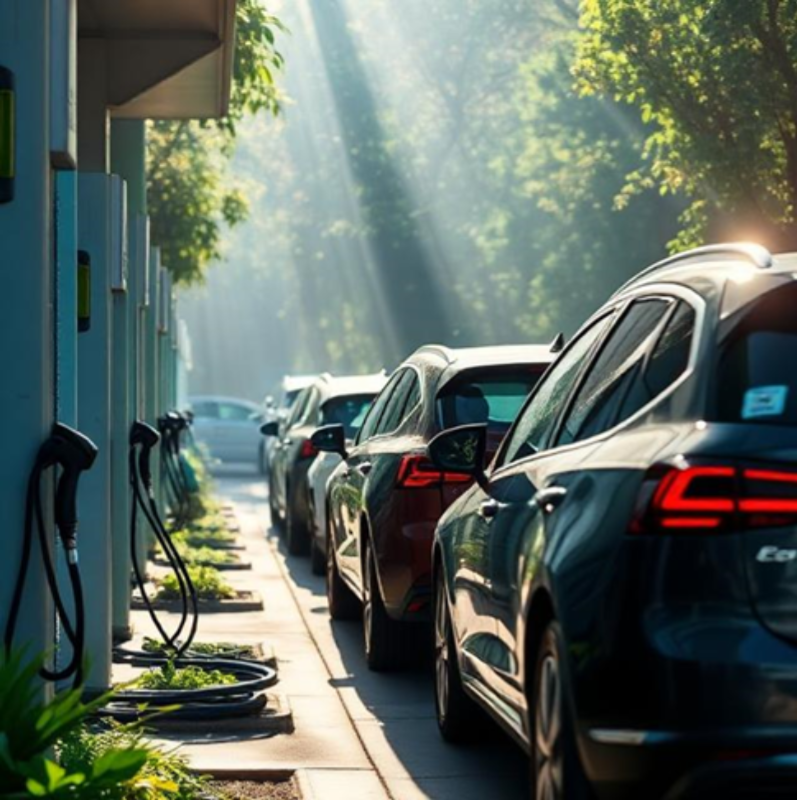
U.S. EV sales reached $\sim$1.6 million in 2024 even as growth cooled; battery mineral demand persists but shifts toward the most cost effective chemistries (LFP/LMFP vs. nickel rich) and the lowest cost, most reliable supply. [11, 12, 13]
Implication for mining: these four signals compress the timeline from abstract forecasts to active procurement cycles. Transmission planning and EV build outs determine what metals lead; the IIJA clock determines when aggregates and cement are needed.
Cross-cutting: AI improves supply—but demand is policy + people
Autonomous haulage, predictive maintenance, and site wide connectivity are reducing cost per ton and downtime at scale—helping margins across commodities. But none of that creates end use demand; policy choices (EPA rules, FERC grid planning, state procurement) and people/economic activity do. Put simply: AI is making suppliers efficient, but can’t replace the consumer.

The Long-Term Headwind: Demographic Contraction and Shifting Demand
Beyond cyclical policy stimulus, the defining structural shift for commodities post-2030 will be demographic contraction. Falling fertility rates across advanced economies (including the U.S., Europe, and China) and the aging of the Baby Boomer generation create a long-term headwind against material volume growth.
Shrinking Working Age: A decline in the working-age population constrains GDP growth and, critically, reduces the demand for new, large-scale infrastructure and residential construction projects (e.g., new schools, highways connecting large subdivisions).
The Shift in Spending: Aggregate consumer spending shifts away from high-volume housing and child-related goods (which require significant raw materials like aggregates, steel, and cement) toward services, particularly healthcare, senior care, and localized community maintenance.
Implications for Materials: This demographic profile favors commodities driven by resilience and replacement (e.g., copper for grid stability, clean steel for efficiency, specialty metals for medical devices) over bulk materials that depend on massive population and labor force expansion. It also strengthens the role of precious metals in wealth preservation during periods of economic uncertainty and generational wealth transfer.
Timeline Deep-Dive by Commodity (clear drivers + politics + demographics)
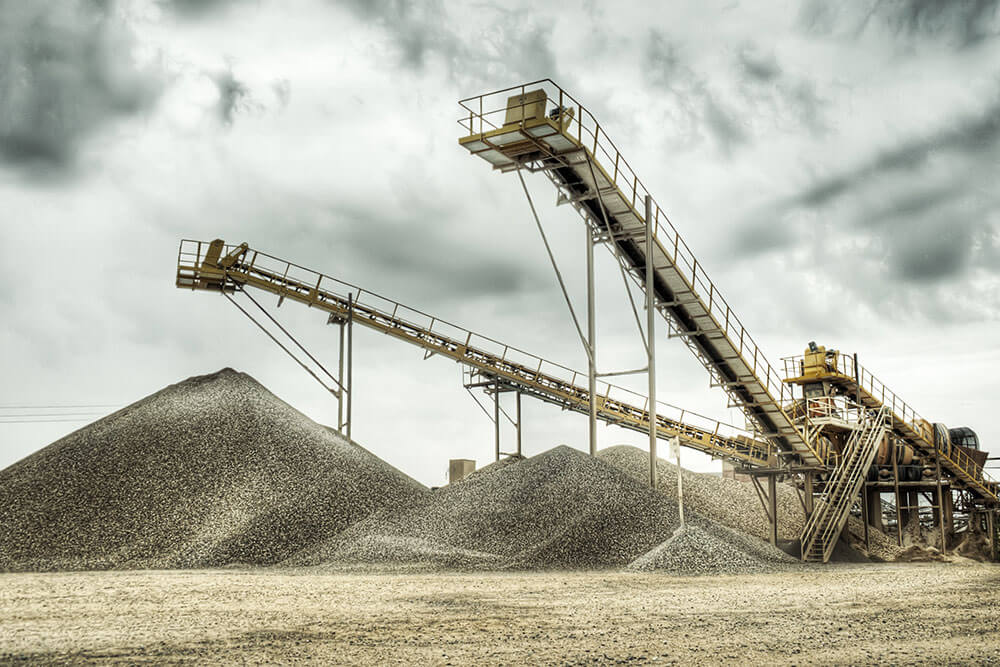
1) Aggregates (stone, sand, and gravel)
• 2025–2026 (near term). States are still drawing down IIJA highway/bridge apportionments into resurfacing, bridge repair, and safety projects—stabilizing orders even if single family housing is choppy; in practice, that’s steady truckloads of crushed rock, sand, and gravel into public jobs. [2, 5, 6]
• 2027–2030 (mid-term). If highway programs aren’t extended at similar levels, resilience (flood control, wildfire hardening), repair and remodel, and urban infill become the backbone; the mix tilts from big new subdivisions to “keep it-working” projects that still consume base material.
• 2030s+ (longer run). Demographic shift deepens: Residential demand falls as the rate of new household formation slows and the population ages. Tonnage flows favor sites with short trucking radii and rail/barge options into established growth corridors; repair and resilience (grid hardening, water works) are the primary growth drivers, demanding fewer raw tons but emphasizing higher quality specifications. Location and logistics outrank sheer pit size.
• Policy context. IIJA reauthorization, regional bond cycles, and streamlined NEPA under the 2023 Fiscal Responsibility Act affect permit timing; faster gates mean capacity gets added where approvals and funding line up first. [4]

2) Precious metals (gold and silver)
• 2025–2026. Gold is supported by investors and central banks; silver’s industrial pull set a record ($\sim 680.5$ Moz in 2024) from PV, electronics, and grid gear—demand is coming from factories and solar fields, not just hopes. [7]
• 2027–2030. Jewelry may flatten as all Boomers are $65+$ by 2030, while wealth transfer and hedging support gold; silver follows the pace of solar and power electronics deployments. [1]
• 2030s+. Gold remains anchored by its role in generational wealth transfer and as a hedge against global fiscal strain caused by higher dependency ratios. Recycling grows without fully replacing primary needs in PV/electronics; secondary supply helps, but mines still matter.
• Policy context. Power sector rules that accelerate/slow PV deployments and tariff/trade actions on solar components feed directly into silver demand.

3) Copper (plus wiring metals such as aluminum)
• 2025–2026. Grid upgrades, data center interconnections (AI load), and EV charging are already lifting T&D capex and multi year utility plans—creating real orders for wire, transformers, and substation gear; the buildout is underway, so copper is moving now. [8]
• 2027–2030. FERC Order $1920/1920 A$ requires long horizon regional portfolios with clear cost sharing, moving lines from concept to “plan of record”; the IEA points to materially higher copper needs by 2030 as electrification spreads—making demand more predictable. [9, 3]
• 2030s+. Under current policies, transmission investment needs to exceed $\sim$$200$B/yr by the mid 2030s, anchoring sustained copper demand (with aluminum substitution in certain conductors where feasible). Copper demand is uniquely buffered against demographic decline as it is driven by resilience and decarbonization (policy/technology upgrades) rather than pure residential volume. [10]
• Policy context. Outcomes hinge on FERC implementation/courts, state commission cost sharing, and incentives for data center power and grid resilience.
4) Battery minerals (lithium, nickel, cobalt, graphite, manganese)
• 2025–2026. The U.S. sold $\sim 1.6$M EVs in 2024 ($>10\%$ share), but growth cooled; carmakers are favoring cheaper chemistries and reliable suppliers, so winners are low cost lithium and dependable midstream feedstock. [11]
• 2027–2030. Chemistries share the market (LFP/LMFP alongside nickel rich cathodes), reshuffling which minerals are tight; producers that deliver predictable, local supply gain leverage.
• 2030s+. Batteries expand into grid storage and commercial fleets; recycling adds meaningful secondary supply yet does not fully replace new mining. Demand shifts focus from passenger EV volume (sensitive to demographic-driven cooling in new vehicle sales) to stationary grid storage (driven by policy/renewables penetration).
• Policy context. Tailpipe and power plant rules steer adoption timing; clearer rules—either way—help green light mines and midstream plants. [12, 13]

5) Iron ore and steelmaking coal (metallurgical coal)
• 2025–2026. Bridges, ports, and heavy infrastructure keep plate/long products busy even if housing is bumpy; margins hinge on rail/port reliability and freight costs. [2]
• 2027–2030. More electric arc furnaces tilt iron unit demand to scrap and high grade pellets, gradually easing reliance on coal intensive blast furnaces—the mix shifts rather than collapses.
• 2030s+. Demographic impact: Lower residential construction demand reduces the need for rebar and structural steel, while decarbonization policy accelerates the transition to EAF/DRI steel production. Cleaner steel needs cleaner power and higher grade ore; regions with cheap, reliable electricity and premium ore access lead.
• Policy context. Industrial decarbonization incentives and power price trajectories determine where low carbon EAF/DRI capacity scales.
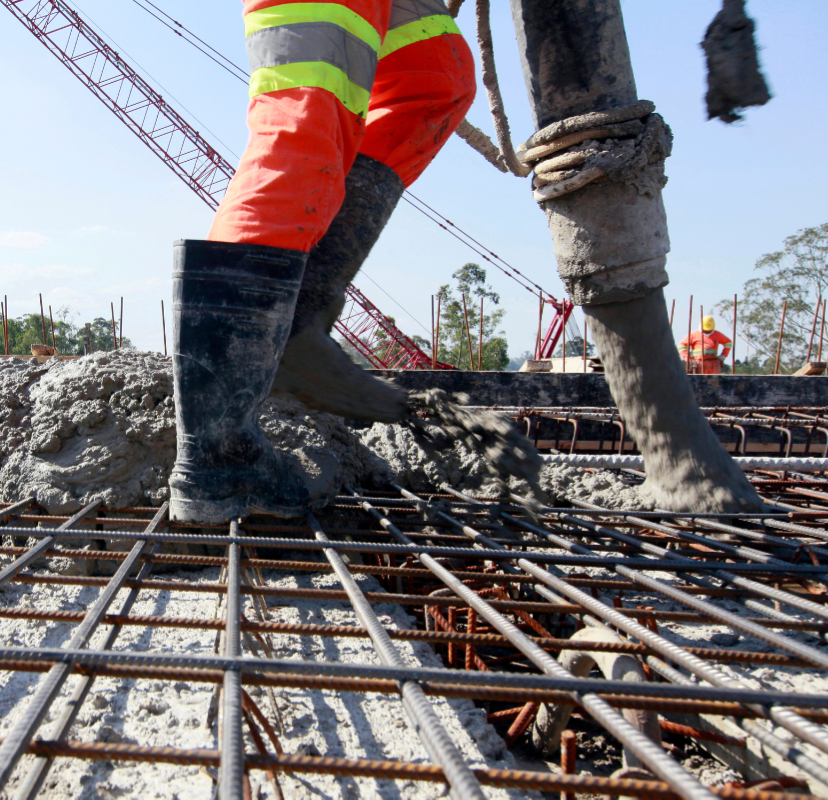
6) Cement & SCMs (fly ash, slag, natural pozzolans)
• 2025–2026. Roads, bridges, and repair and remodel keep cement moving; SCM availability and freight swing both delivered price and carbon scores—contractors feel this in mix cost and spec compliance. [2]
• 2027–2030. States adopt performance based/low carbon specs, lifting demand for SCMs and calcined clays; mix designs stretch clinker further without sacrificing strength.
• 2030s+. Demographic pressure means new construction volume demand for cement (especially residential/commercial) faces a structural decline. Future growth is dictated by resilience and replacement cycles (water systems, utility bunkers, repair) and the shift to low-carbon mixes (SCMs, alternative fuels). Plants electrify processes and use more alternative fuels; wider SCM sourcing makes rail/barge links more important—terminals and logistics become competitive advantages.
• Policy context. “Buy clean” standards and faster permits determine how quickly lower carbon mixes reach jobsites; specs and approvals govern pace. [4]

7) Rare earths & magnet materials (NdPr, dysprosium, terbium)
• 2025–2026. Wind turbines, EV motors, and defense keep a firm floor under demand, while governments back processing/separation outside single country choke points—supply chains are diversifying, not shrinking.
• 2027–2030. Magnet plants expand in the U.S. and allied countries; designs trim dysprosium/terbium intensity while NdPr stays central—efficiency tweaks don’t remove the need for core magnet metals.
• 2030s+. Magnet recycling scales as environmental/labor standards tighten; “urban ore” grows, but new projects still depend on permitting. Demand remains robust as motors and clean power technologies (unaffected by population decline) remains critical.
• Policy context. Defense Production Act tools, export controls, and onshoring incentives shape where capacity lands.

8) Fertilizer minerals (phosphates, potash)
• 2025–2026. Volumes track farm income, acreage, and exports; crop prices and weather—not demographics—drive near term buying.
• 2027–2030. Biofuel mandates, crop mix, and water limits shift regional application intensity; rules and rainfall change where and when nutrients are spread.
• 2030s+. Aging/wealthy populations shift food demand toward higher-value crops, specialty foods, and produce (which can be fertilizer-intensive on a per-acre basis), mitigating the impact of slower population growth. Precision ag times applications more tightly—usage per field gets smarter even if rates level off.
• Policy context. Biofuel, water, river/rail, and trade policies guide regional demand; logistics and rules can outweigh global averages.
Conclusion: Strategic Positioning Amidst Structural Change
Commodity demand is currently driven by a time-compressed convergence of policy deadlines and technological imperatives. The near-term market is framed by fixed public funding schedules, such as the IIJA window and binding FERC transmission rules, which are immediately converting planning into procurement for aggregates, cement, and grid-related metals. Looking beyond 2030, however, the defining structural headwind is demographic contraction. This shift fundamentally changes the profile of materials demand, moving it away from bulk commodities needed for new residential volume and towards specialized materials required for resilience and replacement. Consequently, the long-term winners are those metals essential for decarbonization and grid hardening (such as copper and rare earths), whose demand is structurally buffered against population decline, emphasizing that strategic positioning must prioritize policy-driven technology adoption over pure population-based volume growth.